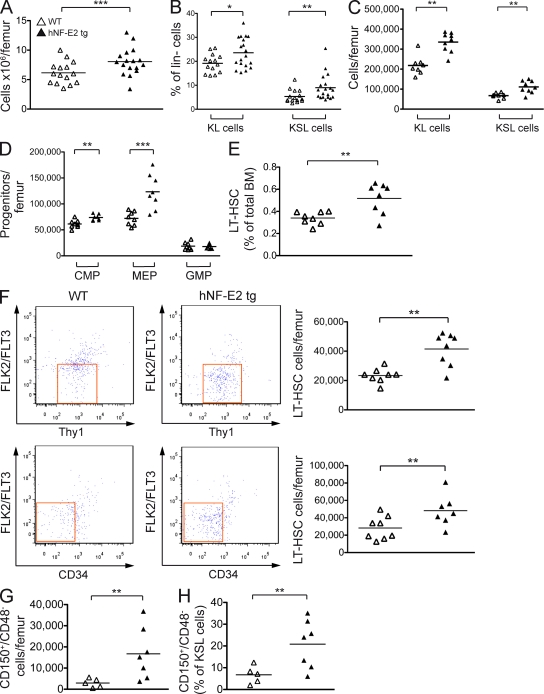
Figure 6.
Hematopoietic stem and precursor populations in hNF-E2 tg and WT mice. (A) BM cells were harvested and enumerated; depicted is the number of cells per femur. (B–D) Cells were stained with antibodies against a cocktail of lineage markers as well as against c-kit, Sca-1, CD34, Fc-γR, Thy1.1, and Flt3/Flk2. (B) Lineage-negative, c-kit–positive, Sca-1–negative (KL) and lineage-negative, c-kit–positive, Sca-1–positive (KSL) cells are depicted as a percentage of lineage-negative cells. (C) The absolute number of KL and KSL cells per femur is depicted. (D) CMPs, MEPs, and GMPs were enumerated as previously described (Passegué et al., 2005), and the absolute number of cells per femur is depicted. (E and F) LT-HSCs were analyzed as previously described (Passegué et al., 2005). (E) LT-HSCs are depicted as a percentage of total BM. (F) The absolute number of LT-HSCs per femur is depicted. (G and H) Cells were stained with antibodies against a cocktail of lineage markers as well as against c-kit, Sca-1, CD150, and CD48. HSCs were analyzed as previously described (Kiel et al., 2005). (G) Absolute number of CD150+/CD48− HSCs per femur. (H) Percentage of CD150+/CD48− cells within the KSL (kit+, Sca-1+, lin−) compartment. (A–H) All data include mice of both strains, 9 and 39; no differences were observed between the two tg strains (n = 5–17 per genotype, as indicated). Horizontal lines indicate the mean. *, P < 0.05; **, P < 0.01; ***, P < 0.001.

