Figure 8.
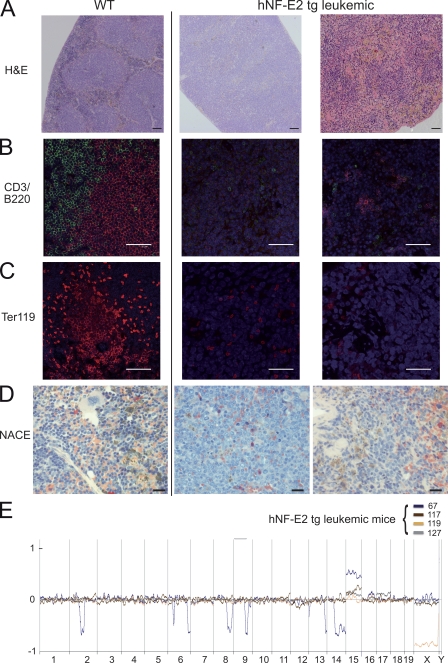
Phenotypic characterization of the leukemia arising in hNF-E2 tg mice. (A–D) Representative spleen histologies of WT mice (left) and NF-E2 tg mice with leukemic transformation (right). (A) H&E staining. (B) CD3 (green) and B220 (red) immunofluorescence staining. (C) Ter119 immunofluorescence staining. (D) NACE staining. NACE-positive cells stain red. Bars: (A) 100 µm; (B and C) 50 µm; (D) 20 µm. (E) Array-CGH of leukemic hNF-E2 tg mice and WT littermates. Genomic DNA of BM from individual leukemic hNF-E2 tg mice (n = 4, 1 from strain 9 and 3 from strain 39; identified by mouse number in the key) was hybridized to genomic DNA from a pool of n = 10 WT littermates. hNF-E2 tg genomic DNA was labeled with Cy3-dUTP, and WT DNA was stained with Cy5-dUTP. Detection of an equal amount of fluorescence in both DNAs results in a plot along the axis in the middle of the graph. Loss of DNA is depicted as signals below the axis, and gain of genetic material is depicted as signals above the axis.

