Figure 1.
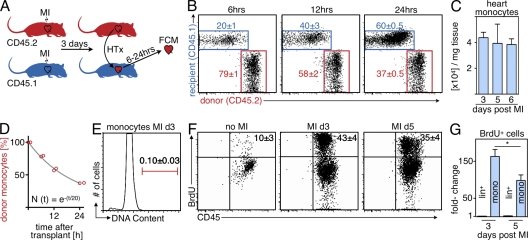
Monocyte infarct residence time after ischemia. Cell tissue kinetics were studied using flow cytometric analysis (FCM) of heart transplants and BrdU pulse experiments. (A) Schematic set-up of the experiment (n = 16; experiment was performed four times). (B) Dot plots of FCM analysis showing the contribution of donor- and recipient-derived Mo in the infarcted heart at 6, 12, and 24 h after transplantation of the heart. (C) Number of Mo retrieved from digested infarcts on day 3 to 6 after MI by FCM. (D) Fitting of donor Mo (y-axis) over time (x-axis). Red circles indicate individual data, the gray line represents the fit described by the equation. (E) Flow cytometric DAPI staining of Mo in the infarct on day 3 after coronary ligation. (F) FCM analysis of the infarct 24 h after BrdU pulse. Dot plots are gated on Mo. (G) Fold-change in BrdU+ Mo and lineage+ cells in the heart after MI. Mean ± SEM (n = 3–10 per group, experiment was repeated twice). *, P < 0.05.

