Figure 5.
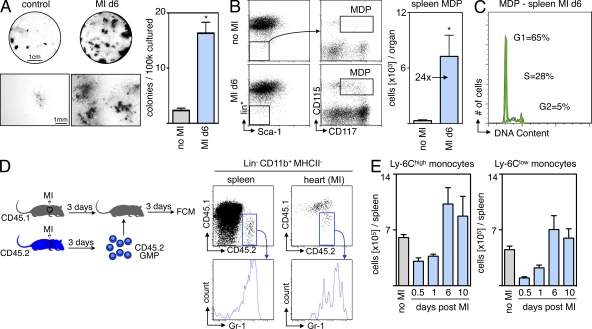
MI induces extramedullary monocytopoiesis in the spleen. (A) CFU assay of splenocytes from naive mice and from mice 6 d after MI (n = 3 per group, experiment performed twice). Top images show representative scans of the culture plate, bottom images show magnifications of colonies. (right) Bar graph enumerates colonies in cultures. (B) Representative dot plots from spleen and enumeration of splenic MDPs. lin* indicates lineage for myeloid progenitor staining as described in the Materials and methods section (n = 6–9 per group from three independent experiments). (C) Cell cycle analysis for splenic MDPs in mice after MI (n = 3 per group from one experiment). (D) Adoptive transfer of GMPs on day 3 after MI. CD45.2+ cells were transferred into infarcted CD45.1+ mice, which were analyzed 3 d later. Dot plots show adoptively transferred precursors in the splenic pool and the infarcted myocardium (n = 6 from one experiment). (E) Ly-6Chigh and Ly-6Clow Mo in the spleen after MI. Mean ± SEM (n = 4–10 per group from 4 independent experiments). *, P < 0.05.

