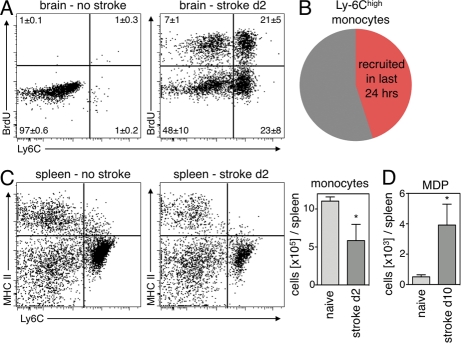
Figure 9.
Rapid Mo kinetics and supply of splenic Mo in stroke. (A) Dot plots from brain tissue gated on CD11b+ and lineage− cells 24 h after BrdU pulse. Mean ± SEM (n = 4–5 per group; P < 0.05 stroke vs. no stroke). (B) Pie chart illustrates turnover of Ly-6Chigh Mo in the brain on day 2 after stroke. (C) Number of Mo in the spleen after stroke. Dot plots are gated on CD11b+ lin− cells and compare naive control mice to mice 2 d after stroke. Bar graph shows total Mo in the spleen. Mean ± SEM (*, P < 0.05; n = 4–5 per group from one experiment). (D) Increased MDP on day 10 after stroke in the spleen. Mean ± SEM (*, P < 0.05, n = 4–5 per group from one experiment).

