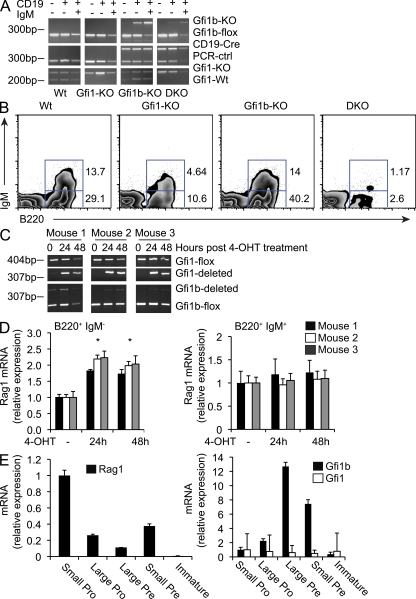
Figure 3.
Inactivation of both Gfi1 and Gfi1b results in a severe block in B cell development. (A) Genotyping results for Gfi1+/− (Wt), Gfi1 KO (Gfi1-KO), Gfi1+/− CD19-CRE–induced Gfi1b KO (Gfi1b-KO), and Gfi1/1b DKO mice. PCR was performed on genomic DNA from sorted CD19+IgM+, CD19+IgM−, and CD19−IgM− cells. This data representative of three similar analyses. (B) Flow cytometric analysis of B220 and IgM expression on bone marrow cells from Wt, Gfi1-KO, Gfi1b-KO, or DKO mice as indicated. Although B cell numbers in the DKO samples were variable, this result is representative of three similar analyses. (C) PCR analysis for the presence or absence of the Gfi1 and Gfi1b floxed alleles in bone marrow isolated from Gfi1bflox/flox Gfi1flox/flox ER-Cre mice and treated with tamoxifen (4-OHT) for the indicated time points. This data are representative of two independent analyses. (D) Quantitative RT-PCR analysis of Rag transcripts in IL-7–cultured B220+IgM− (left) and B220+IgM+ (right) bone marrow cells sorted from Gfi1bflox/flox Gfi1flox/flox ER-Cre mice and treated with tamoxifen (4-OHT) or vehicle control. Data are shown for three mice and is representative of three independent experiments. Error bar represents standard deviation of triplicate PCR assays. * indicates a significant difference according to a Student’s t test (P ≤ 0.004 for all mice analyzed). (E) Quantitative RT-PCR analysis of Rag, Gfi1, and Gfi1b transcripts in sorted bone marrow cell fractions from WT mice. Cells were sorted as follows: small pro, IgM−B220+CD43+ forward scatter (FSC) low; large pro, IgM−B220+CD43+ FSC high; large pre, IgM−B220+CD43− FSC high; small pre, IgM−B220+CD43− FSC low; immature B, IgM+IgD−. Error bar represents standard deviation of triplicate PCR assays. This data are representative of three independent experiments.

