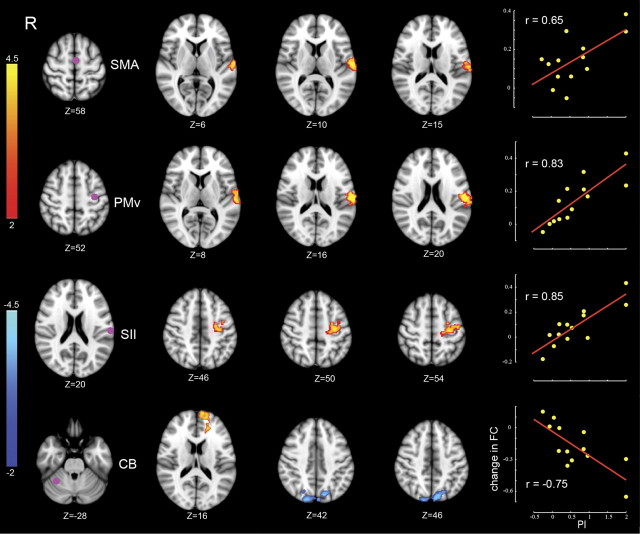
Figure 2.
Changes in connectivity in relation to perceptual change. Each row corresponds to a specific ROI whose FC is changed in relation to perceptual learning. Left column, Location of ROIs. Two middle columns, Clusters showing significant change in connectivity with the corresponding ROI. Color-coded statistical Z score maps (corrected p < 0.05 for spatial extent) showing increases in positive correlation (coded in red to yellow) and negative correlation (coded in dark to light blue) from day 1 to day 2 with respect to PI (z-coordinates of cross-sections are reported in MNI space). Right column, The linear trend between individual changes in FC and associated PI values on a per-subject basis. ΔFC gives the change in FC averaged over the significant clusters (the change in FC in the bottom row is shown with respect to the blue-coded clusters alone). The value of r represents the Pearson's product-moment correlation coefficient.

