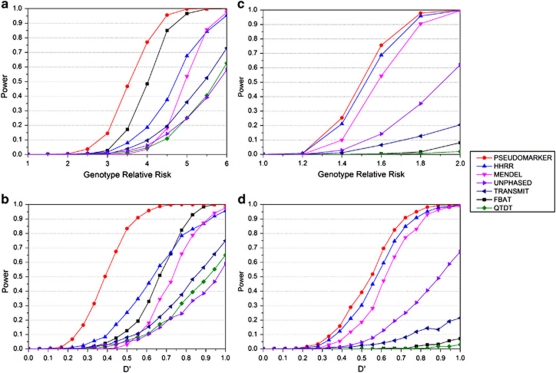
Figure 2.
(a) Schizophrenia data with recessive model, the genotype relative risk scan and (b) the D′ scan and genotype relative risk fixed to six. As in Figure 1, the analysis models recommended by the authors are used here, if that test was valid according to the simulations in Figure 1. When the type-I error rates were not correct from Figure 1, we substituted other statistics from those programs that were giving accurate type-I error rates as follows: the analysis model and option for each the programs were: PSEUDOMARKER (MRec LD-given linkage), FBAT (recessive), MENDEL (MRec*,fixed1, association given linkage), HHRR (allele-based randomized), TRANSMIT (one), QTDT, UNPHASED (plain, cc). (c) Migraine data with dominant model, the genotype relative risk scan, and (d) the D′ scan and genotype relative risk fixed to two. The analysis model and option for each of the programs were: PSEUDOMARKER (MDom LD-given linkage), FBAT (dominant), MENDEL (MDom*,fixed1, association given linkage), HHRR (allele-based randomized), TRANSMIT (nonuc, ro), QTDT, UNPHASED (plain, cc). Results are based on 1000 replicates.

