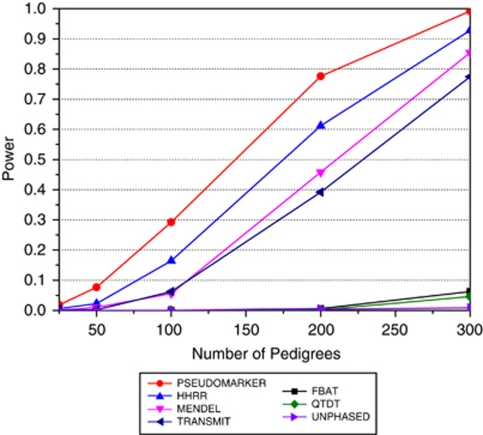
Figure 3.
The ForSim-simulated data; there was one population, five chromosomes, three genes per chromosome (one gene per chromosome contributing to the disease phenotype additively). ForSim-generated data which contained 10 000 multigenerational pedigrees and 1000 controls. SNP selected for analysis was linked and associated with the trait, with allele frequency 0.124, and estimated odds ratio of 1.673. Various numbers of pedigrees (25, 50, 100, 200, and 300) were randomly sampled w/o replacement and power was computed at α=0.0001 level, based on 500 replicates. The analysis model and option for each the programs were: PSEUDOMARKER (MRec LD-given linkage), FBAT (recessive), MENDEL (MRec*,fixed1, association given linkage), HHRR (allele-based randomized), TRANSMIT (one), QTDT, UNPHASED (plain, cc). Between the five specific numbers of pedigrees tested (x-axis), power estimates are made by linear interpolation.

