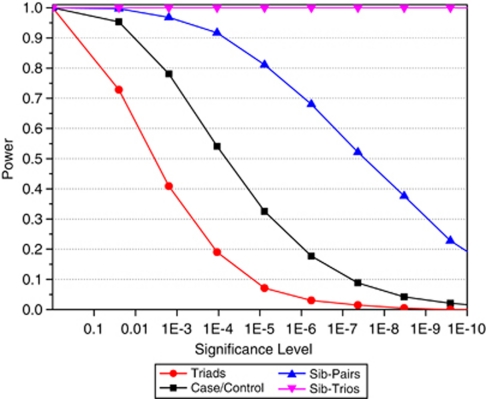
Figure 4.
Power increase from sampling family data rather than unrelated individuals: total sample size (number of genotyped individuals) is identical for each data structure. Singletons=2000 cases and 2000 controls. Triads=1000 triads and 1000 controls. Sibpairs=800 sibpairs and 800 controls. Sib trios=667 sib trios and 665 controls. In all, 4000 total individuals per sample. This is for a model with complete LD, complete linkage, and a recessive model with relative risk of four, disease allele frequency of 10%, and disease prevalence of 10%. The test statistic used was recessive PSEUDOMARKER LD-given linkage.

