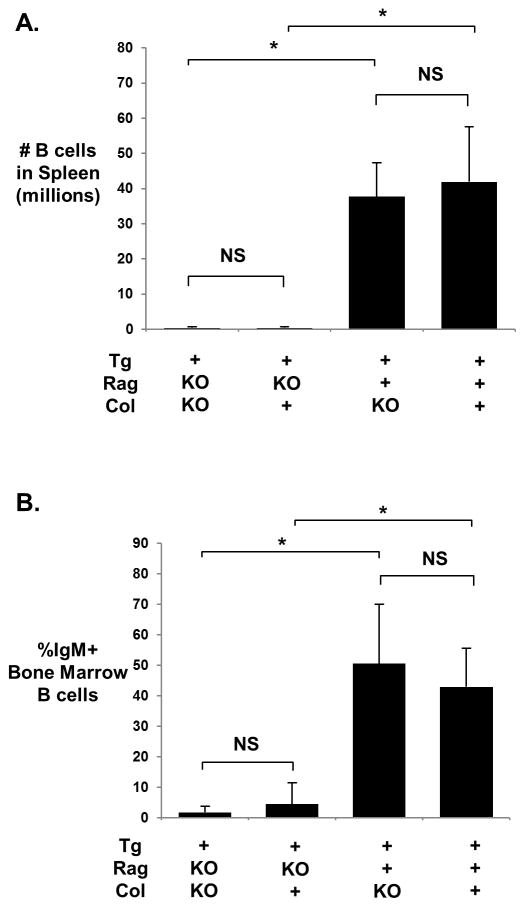
Figure 2.
Mean ± standard deviation for spleen B cell count (A) and % IgM+ Bone Marrow B cells (B). N=4–5 for all groups using data from 4 experimental replications. Significant differences were determined by pairwise comparison using the Wilcoxon test and are indicated by asterisks; *, p<0.05; NS, p>0.05.

