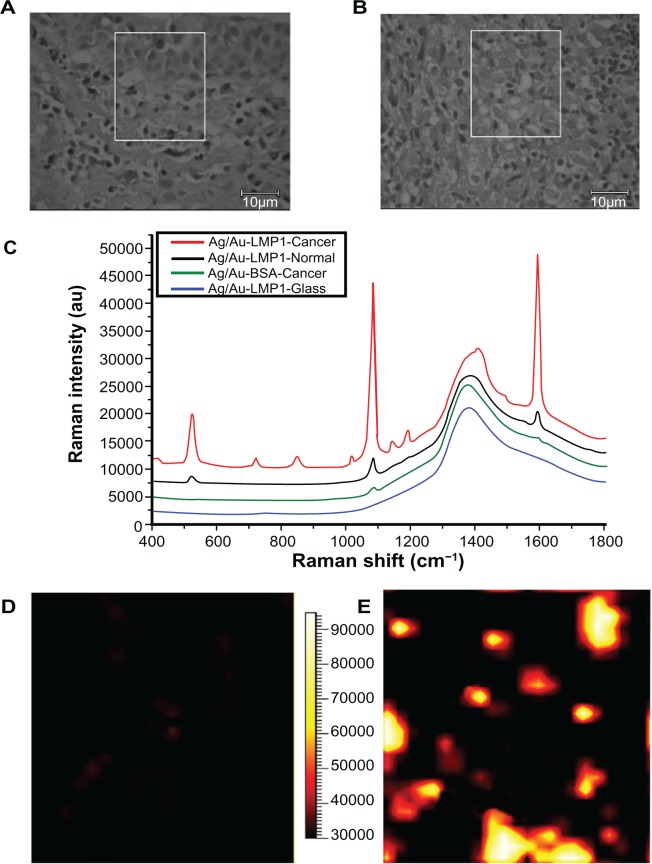
Figure 4.
(A) and (B) Bright field images of a region from examples of normal and cancerous nasopharyngeal tissue sections, respectively; (C) are the representative spectra obtained from latent membrane protein 1 surface-enhanced Raman scattering probes in cancerous nasopharyngeal tissue (red), normal nasopharyngeal tissue (blue) and glass (black), as well as nontargeted surface-enhanced Raman scattering probes (bovine serum albumin surface-enhanced Raman scattering probes) in cancerous nasopharyngeal tissue (green); (D) and (E) demonstrate surface-enhanced Raman scattering images of example of normal tissue and cancerous tissue, respectively. The surface-enhanced Raman scattering images were acquired by scanning the laser beam to cover the white boxes in (A) and (B), respectively.

