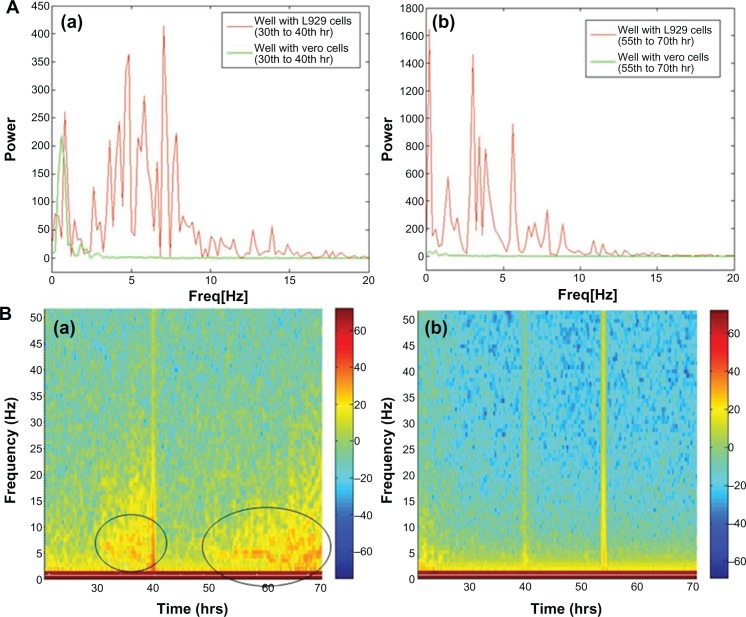
Figure 3.
(A) Power spectrum analysis of L929 cellular oscillation compared to vero cells at different time periods from (a) 30 to 40 hrs and (b) 55 to 70 hrs. (B) Time-frequency plots for cellular oscillation. (a) L929 cells (b) vero cells.
Note: Black circles show oscillation frequencies.
Abbreviations: ATP, adenosine triphosphate; ECIS, electrical cell-substrate impedance-sensing system.

