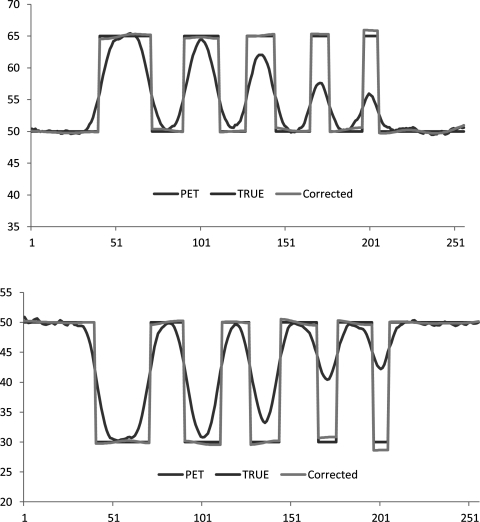
Figure 2.
Signal profiles of uncorrected PET, true intensity, and corrected intensity cross the centers of simulated circular objects that are shown in Fig. 1a. Top: profiles from the first row of simulated circular objects. Bottom: profiles from the last row of simulated circular objects.

