
Figure 1. Fxyd1 mRNA abundance is greater in the FC than the CB of mice, and increase in the FC, but not the CB of Mecp2-null mice.
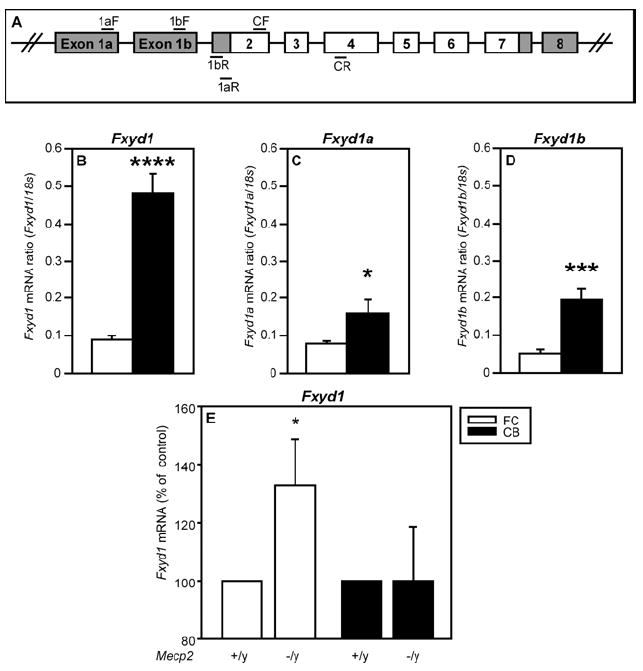
A, Diagram showing the organization of the Fxyd1 gene with exons and introns represented by boxes and lines, respectively. Primers used for qPCR are shown by horizontal bars (aF, bF = exon 1a or 1b forward; aR, bR = exon 1a or 1b reverse; CF = coding region forward; CR = coding region reverse). Panels B-D compare Fxyd1 mRNA levels detected in the FC and CB of WT mice; panel E shows the change in Fxyd1 mRNA content seen in the FC and CB of Mecp2 KO mice in comparison to WT animals. B, Fxyd1 mRNA (coding region). C, Fxyd1a mRNA. D, Fxyd1b mRNA. E, Fxyd1 mRNA levels increase in the FC, but not the CB, of Mecp2-/y mice as compared with Mecp2+/y littermates. Bars are means and vertical lines represent SEM. The number of animals per group is n=6 for 1B-D and n=9 for 1E. B-D, *=p<0.05; ***=p<0.001, FC vs CB. E, *=p<0.05 Mecp2-/y vs. control littermates (Mecp2+/y).