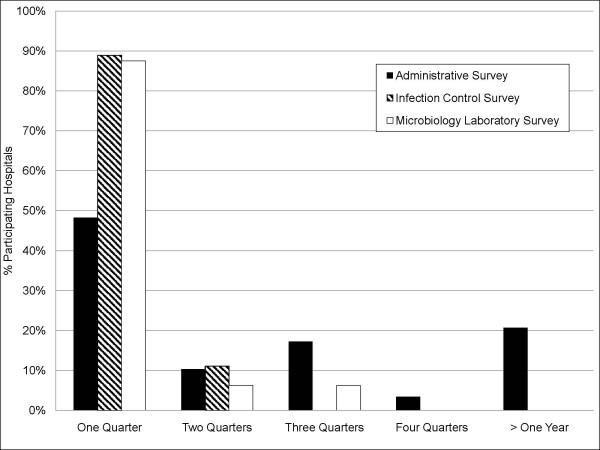
Figure 3.
Graphical display of the recruitment time in quarters required to secure hospital participation in facility-level surveys. Black bars indicate percent of hospitals participating in the Administrative Survey (N = 29); hatched bars, the Infection Control Survey (N = 27); and white bars, the Microbiology Laboratory Survey (N = 16 laboratories serving 31 hospitals).

