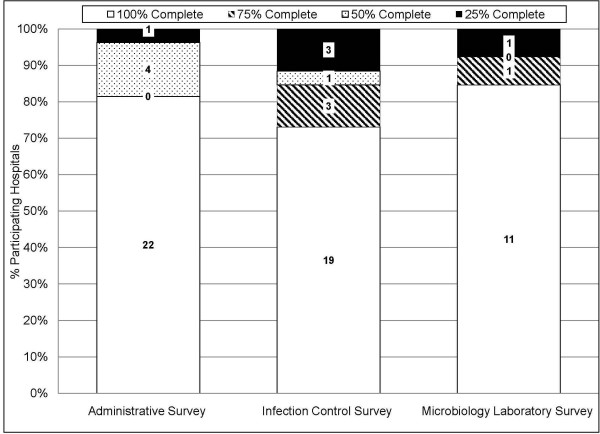
Figure 5.
Bar graph depicting the degree of survey completeness by survey type. White bars indicate surveys were 100% completed; hatched bars, 75% completed; dotted bars, 50% completed; and black bars, 25% completed. Missing or non-existent data, electronic data limitations, and prohibitively large labor requirements were responsible for the return of incomplete surveys.

