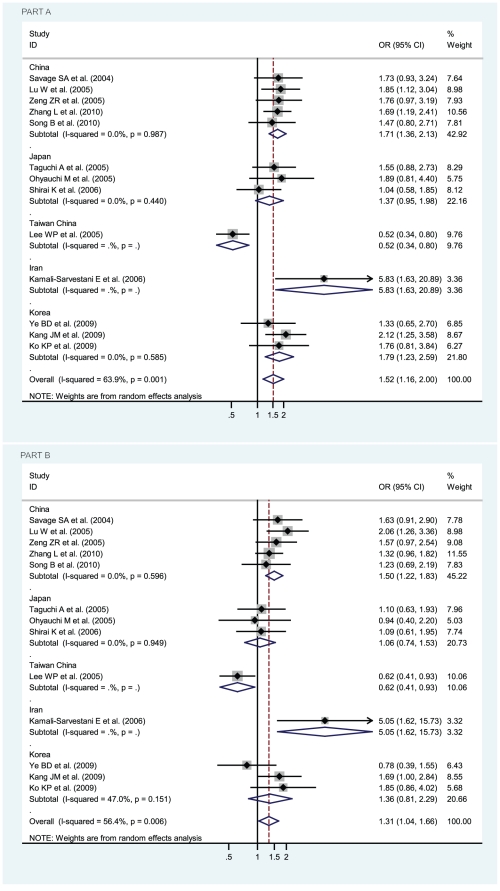
Figure 3. Odds ratios (ORs) for associations between IL-8 -251 A/T SNP and gastric cancer risk among geographically Asian participants from China, Taiwan China, Japan, Korea, and Iran.
The sizes of the squares indicate the relative weight of each study. Bars, 95% confidence interval (CI). A) The IL-8 -251 AA genotype versus TT genotype; B) The IL-8 -251 AA genotype versus TA genotype.

