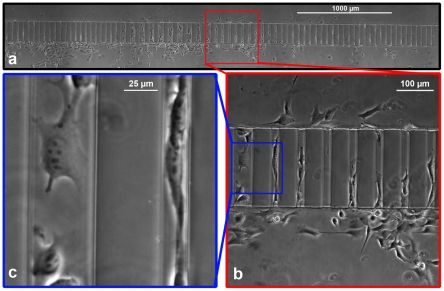
Figure 2. Dynamic optical range for variable-scale analysis of cellular behavior.
a) A panoramic micrograph was automatically stitched from multiple adjacent fields of view to visualize the microchannel array. (Pictured: HOS cells after 5 h of migration). b) A single field of view from the stitched montage shown in panel (a), captured with a 10× objective. (Pictured: cells migrating in 50 µm and 20 µm microchannels). c) A cropped section of the image in panel (b) shown at 100% zoom.

