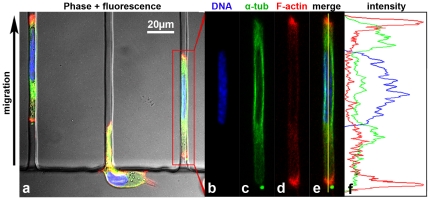
Figure 5. Confocal analysis of HOS cells migrating in 3 µm-wide microchannels.
(a) A composite image (three-color fluorescence+differential interference contrast) depicts two cells inside 3 µm-wide microchannels, and a third cell entering a microchannel. (b) DAPI staining indicates an elongated nucleus distinct from the typical nuclear morphology on a flat 2D surface. (c) FITC-conjugated anti-α-tubulin labeling indicates that tubulin concentrates in a cytoplasmic and perinuclear region. (d) Phalloidin staining for F-actin revealed a specific enrichment of F-actin at the cell poles. (e) A fluorescence overlay image indicates the distinct subcellular localization of tubulin and F-actin, which is quantitatively represented in a color-coded intensity profile (sampled region is indicated by vertical yellow line) (f).

