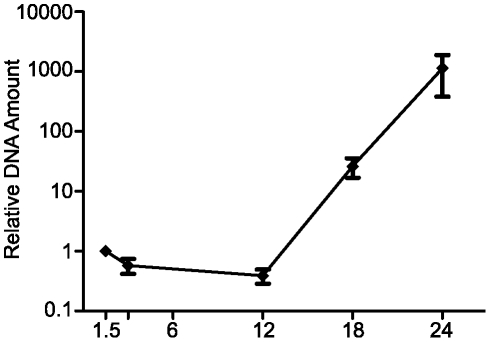
Figure 3. Viral DNA replication kinetics in mouse fibroblasts.
MCMV DNA content on total DNA collected from MCMV infected cells analyzed by Q-PCR at 1.5, 3, 12, 18 and 24 hpi as indicated. Each graph displays the mean value and S.E.M. for, with data from three independent assays. The results are presented as the relative IE1-3 DNA amount normalized to a cellular reference, Dlx1.

