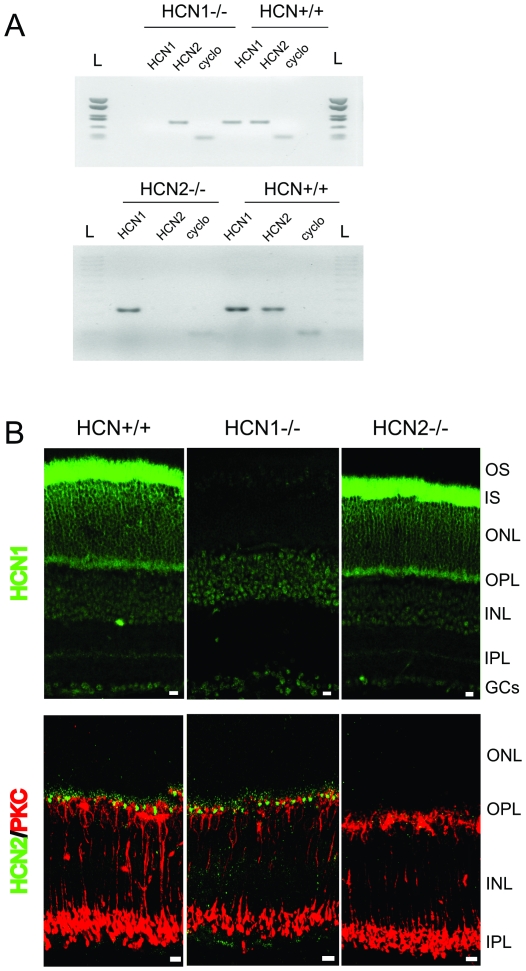
Figure 1. Transcript expression and immunohistochemistry of HCN channels.
A: HCN channel 1–2 mRNA expression in murine retina. The amount of HCN amplicons is compared to cyclophilin expression. B: Confocal images of retinal sections immunolabeled with rabbit polyclonal antibodies (green fluorescence) specific for HCN1 (upper panel) and HCN2 (bottom panel) in HCN+/+, HCN1−/− and HCN2−/− mice. In addition to immunolabeling with the antibody for HCN2 (bottom panel), the retinas were also stained with an antibody against PKC, a specific marker for rod bipolar cells (red fluorescence). Scale bars, 10 µm.

