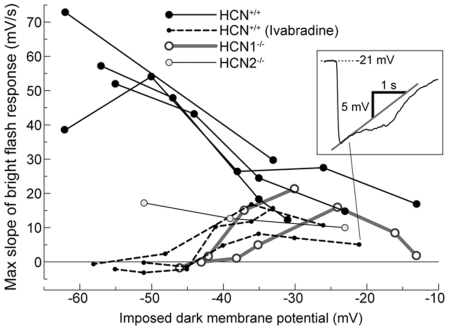
Figure 4. Summary graph of the degree of nose in the bright flash response in HCN+/+, HCN1−/− and HCN2−/− mice, as a function of dark membrane potential (Vd).
The nose was quantified by taking the maximum slope of photovoltage trajectory in the first second following the flash (inset). The dark membrane potential was imposed by constant current injection. Inspection of the data shows that Ih is entirely responsible for generating the nose at hyperpolarized potentials, while at depolarized potentials this role is played by another current, presumably Ikx. There may exist a range of Vd within which both mechanisms cooperate to quicken the bright flash response of rods.

