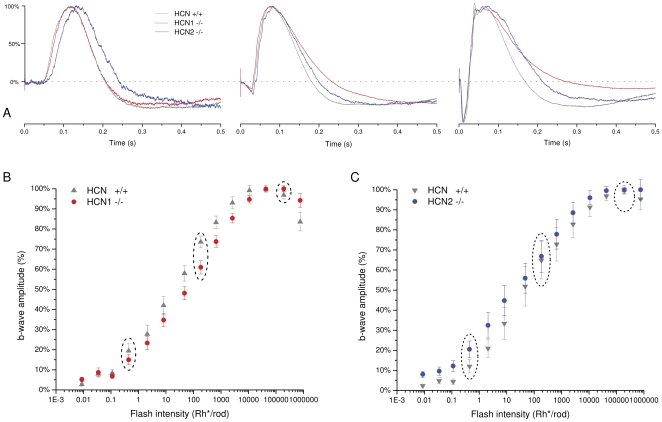
Figure 5. ERG response to flashes of increasing intensity.
A: averaged ERG responses of increasing light intensity in the HCN+/+ (gray, n = 18), HCN1−/− (red n = 18) and HCN2−/− (blue, n = 10). Dim, intermediate and bright flash intensities are shown in the left, middle and right panel, respectively. B–C: collected data of the b-wave peak amplitude as a function of the flash intensity in HCN+/+, HCN1−/− and HCN2−/−, relative amplitudes were normalized at their maximum value. The intensity of the flash is expressed as a number of photoisomerizations per rod (Φ) per flash. The dotted ovals in B indicate the dim, intermediate and bright flash responses illustrated in A.

