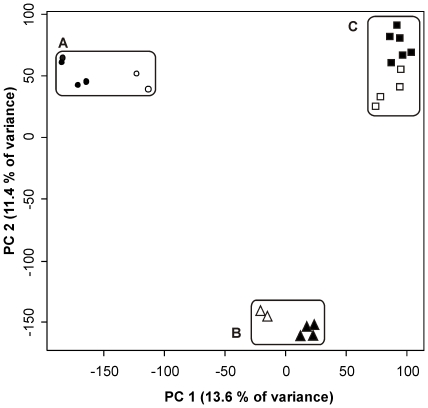
Figure 4. PCA plot visualizing separation of metaproteomic data according to technical-replicates, time points and subjects.
Feature intensities of 22 LC-MS runs were plotted according to the first two principal components. Technical replicates of the first time point are presented in grey and measurements from the second time point are in black.

