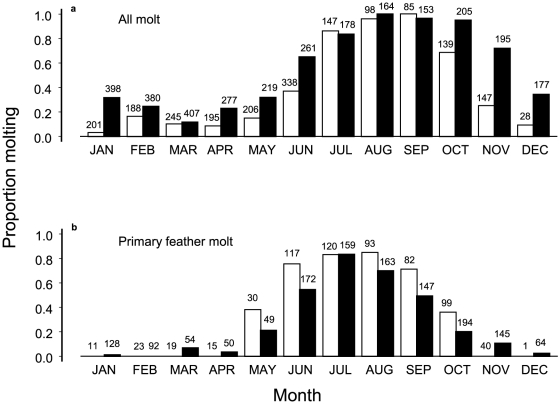
Figure 1. Overall changes in monthly molt between time periods.
(a) Proportion of birds of all native species during initial capture molting each month during 1989–1999 (white bars) and 2000–2006 (black bars). (b) Proportion of molting birds that were molting primary flight feathers. Sample sizes are above bars. Analysis of deviance from logistic regression for any molt is in Table 1 and for primary molt is in Table 2.

