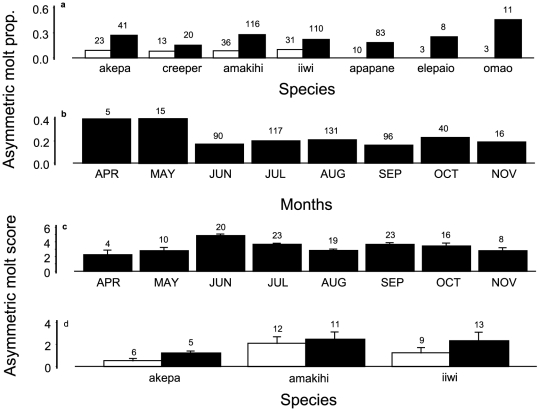
Figure 8. Asymmetric molting of primary flight feathers during 2002–2005.
Sample sizes above bars in all panels: (a) by species, year 2002 in white bars, years 2003–2005 in black bars, showing increase over time; (b) by month. Asymmetric molting scores by month (c) and survival (d). Open bars indicate survivors, black bars non-survivors. Sample sizes above bars. Analysis of deviance for asymmetric molting prevalence from logistic regression is shown in Table 12. Analysis of variance table for molt score is shown in Table 13 for year and month, and in Table 14 for survival.

