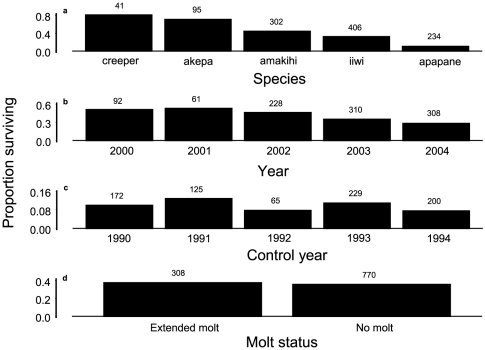
Figure 9. Survival of adult birds captured during January–March.
Panels a, b, and d are for years 2000–2004. Panel c is for control years 1990–1994. Sample sizes are above bars. Logistic regression modeled survival based on species, year as trend, and molting status (extended molt or no molt), with just species and year modeled as trend for the control years. Analyses of deviance from logistic regression are in Table 15.

