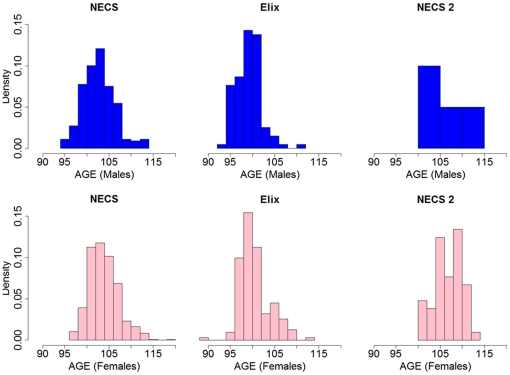
Figure 2. Distribution of age of last contact or age at death of centenarians included in the study.
NECS: centenarians of the discovery set, ELIX: nonagenarians and centenarians from the ELIX replication set, NECS 2: additional NECS replication set of 60 centenarians. The y-axis reports the density, and the x-axis reports the age, in group of 2 years. The frequency of subjects with ages between x and x+2 is 2*density*(sample size).

