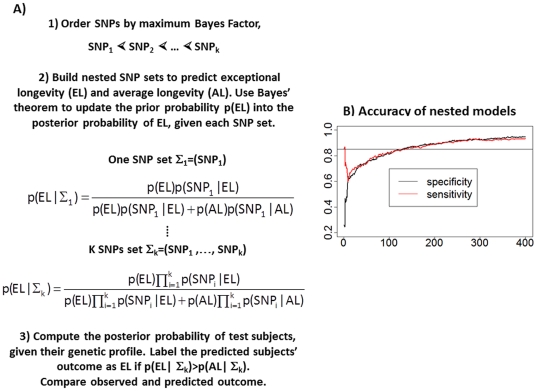
Figure 4. A) Schematic illustration of the genetic risk prediction model.
We ordered SNPs by maximum Bayes Factor in the discovery set and built nested SNP sets starting with the most significant SNP and then adding one SNP at a time from the ordered list. The conditional probabilities of SNP genotypes in centenarians (p(SNPi|EL)) and controls (p(SNPi|AL)) are used to compute the posterior probability of exceptional longevity (p(EL|Σk)) using Bayes' theorem and prior probability p(EL) = 0.5. The classification rule is the standard Bayesian classification rule that is optimal under a 0–1 loss function. B) Sensitivity and specificity of 400 nested models. The x-axis reports the number of SNPs in each of the nested models, and the y-axis reports sensitivity (% of centenarians with posterior probability of exceptional longevity>posterior probability of average longevity) and specificity (% of controls with posterior probability of exceptional longevity<posterior probability of average longevity).

