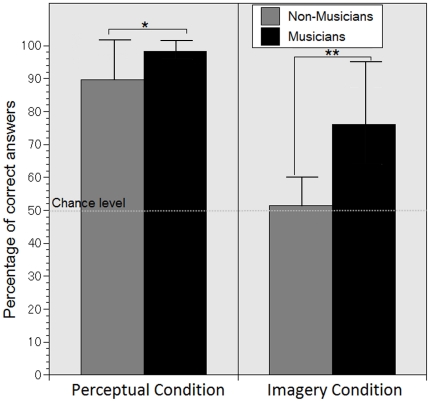
Figure 2. Mean correct answers in percent of the musicians and non-musicians for the imagery and the perceptual condition.
The dashed line represents the chance level and the bar on the graphs represents the standard deviation. The between group difference in the perceptual condition is significant at p<.05 (indicated by *) and in the imagery condition it is significant at p<.01 (indicated by **).

