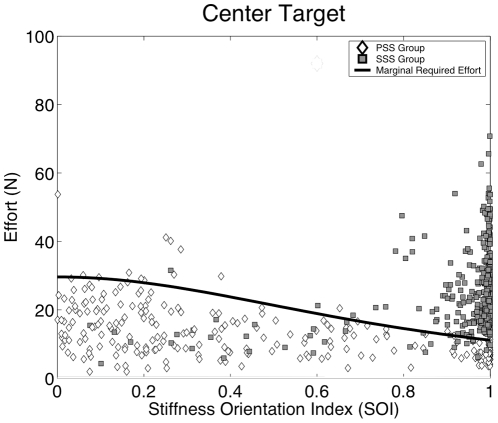
Figure 7. Effort and stiffness orientation affect choice of stabilization strategy.
Plot of the relationship between E and SOI during the stabilization period at the central target area. Data from every trial in the adaptation phase (48×13 = 624 trials) is presented. Gray squares represent SSS subjects while white diamonds represent PSS subjects. The black curve plots the amount of force effort required to reach marginal stability, i.e. the condition in which Kxx = Ku.

