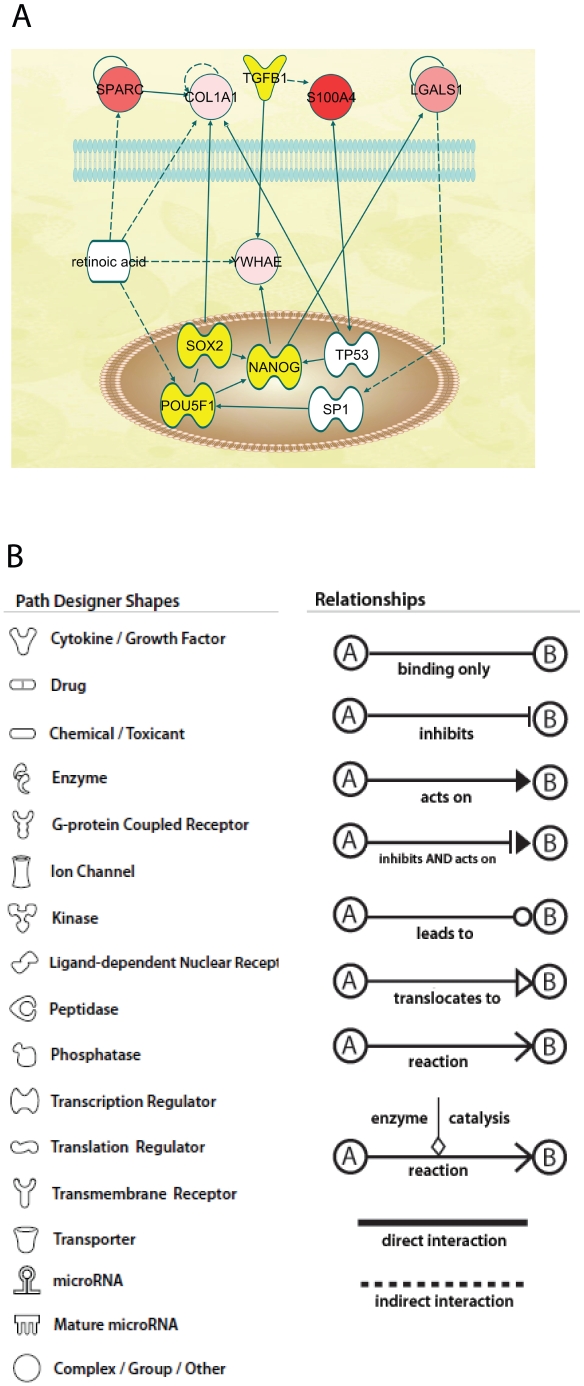
Figure 3. Network diagram for AP cells produced by IPA analysis.
A. The diagram shows the potential interactions of the extracellular proteins with NANOG, SOX2 and POU5F1. Proteins detected in the proteomic study are shown in grey to red. The deeper the red the greater the level of expression. Proteins indicated by IPA analysis and subsequently detected by western blots are shown in yellow. Proteins shown in white are indicated as involved in the network but have not been detected yet. AP cells, antlerogenic periosteum cells. B. Key from IPA (www.ingenuity.com) to network diagram molecules and relationships between them in this Figure and in Figures 4, 5, and 6.

