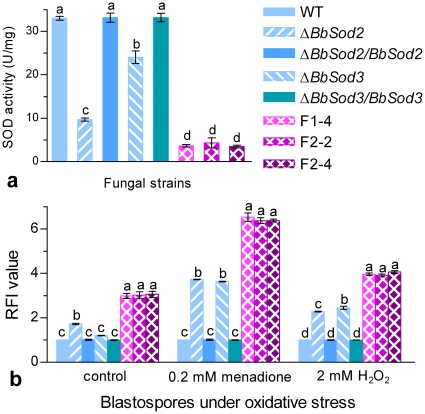
Figure 4. Overall SOD activities and ROS levels in the cells of WT and mutant strains.
(a) SOD activities in protein extracts from 3-day cultures on SDAY at 25°C. (b) Relative fluorescence intensity (RFI) values of the blastospores stained with the fluorescence probe dihydroethidium (DHE). The thin-walled, unicellular blastospores produced in a nitrogen-limited medium (NLM) were resuspended in NLM containing 0.2 mM menadione, 2 mM H2O2 or no oxidant (control) for 1 h incubation prior to staining. Each RFI value indicates the intracellular ROS level of each mutant versus WT under a given condition. Different lowcase letters on the bars of each group denote significanct differences (Tukey's HSD, P<0.05). Error bars: SD of the mean from three replicates.

