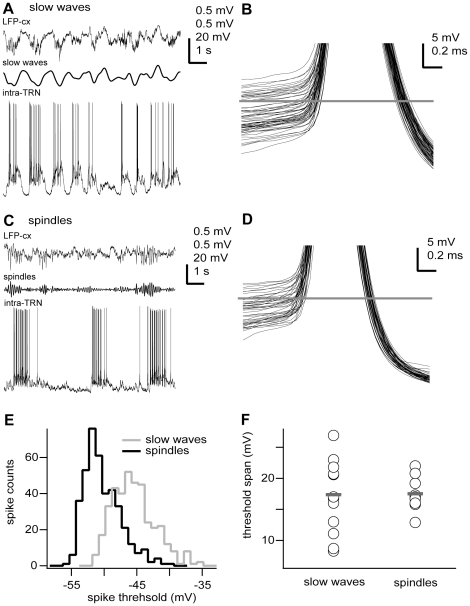
Figure 1. Action potentials of TRN neurons exhibit similarly large threshold voltage range during different network oscillations.
A, C, In vivo intracellular recordings (intra) from two TRN neurons during either slow oscillations (ketamine-xylazine anaesthesia), A) or spindle oscillations (pentobarbital anaesthesia), C) recorded in the neocortex. B, D, Superposition of all action potentials (clipped) depicted on the left column (A, n = 61; C, n = 44) showing the variability in voltage threshold. Horizontal line shows mean voltage threshold for the whole recording epoch (B, −47.7 mV; D, −52.3 mV). Spikes were arbitrarily clipped for illustration purposes only. E, Distribution of spike thresholds for neurons shown in A and C (slow oscillations, n = 381 spikes; spindle oscillations, n = 633 spikes). F, Action potential voltage threshold range for all recorded neurons (slow waves, ketamine-xylazine anaesthesia; spindles, pentobarbital anaesthesia). Circles and grey bars show individual values and means, respectively. Means were not significantly different (p = 0.9089). Intracellular recording (intra-TRN, 0.1 Hz–20 kHz), cortical local field potential (LFP-cx, 0.1 Hz–20 kHz), slow waves (filtered LFP, 0.1–2 Hz), spindles (filtered LFP, 7–15 Hz). Scale bars: A,C, LFP-cx 0.5 mV, slow waves 0.5 mV, spindles 0.5 mV, intra-TRN 20 mV, horizontal 1 s; B,D, vertical 5 mV, horizontal 0.2 ms. Some portions of raw data (intracellular voltage recordings) from the cells in this figure have been used in previous publications (see Methods).

