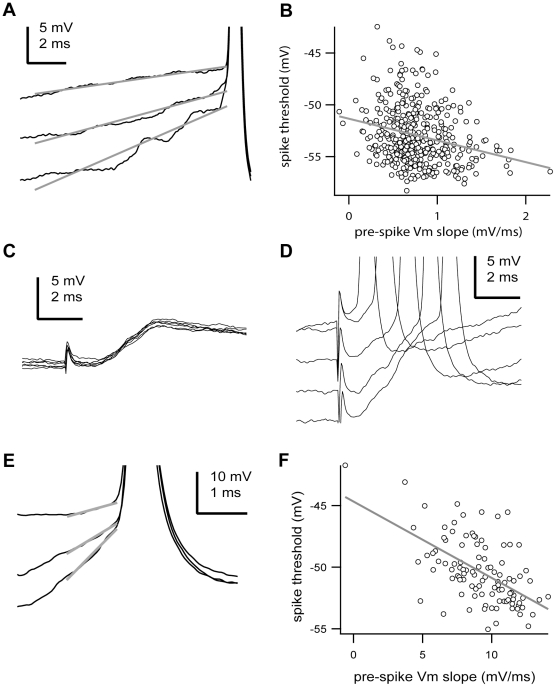
Figure 3. The voltage threshold of action potentials is negatively correlated with the preceding rate of membrane potential depolarization.
A, Three action potentials (clipped) recorded from a TRN neuron are shown with the membrane potential change leading to the action potential onset. Each recording is shown with its respective best-fit line prior (10 ms) to the action potential onset. Spikes were arbitrarily clipped for illustration purposes only. B, Plot of the action potential voltage threshold versus the membrane potential change over the 10 ms preceding each action potential (pre-spike Vm slope) recorded in the cell shown in A. The line is the best-fit line by the equation y(V) = −51.34 mV – 2.09 ms*x(dV/dt), n = 405 spikes, R = −0.2497, p<0.0001, two-tailed t test. C, Subthreshold EPSPs triggered by electrical stimulation of a topographically connected cortical area. Note the long-lasting decay of the EPSPs. D, Suprathreshold EPSPs followed by action potentials with different latencies in the same cell shown in C. Spikes were arbitrarily clipped for illustration purposes only. E, Three action potentials (clipped) triggered by evoked EPSPs are shown with the membrane potential change leading to the action potential onset. Each recording is shown with its respective best-fit line prior (1 ms) to the action potential onset from the cell shown in C. Spikes were arbitrarily clipped for illustration purposes only. F, Plot of the action potential voltage threshold versus the membrane potential change over 1 ms preceding each action potential (pre-spike Vm slope) recorded in the cell shown in C. The line is the best-fit line by the equation y(V) = −44.68 mV – 0.62 ms*x(dV/dt), n = 77 spikes, R = −0.5728, p<0.0001, two-tailed t test. Scale bars: A, C,D, vertical 5 mV, horizontal 2 ms; E, vertical 10 mV, horizontal 1 ms. Some portions of raw data (intracellular voltage recordings) from the cells in this figure have been used in previous publications (see Methods).

