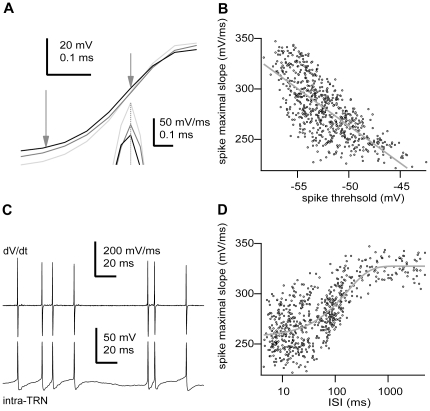
Figure 4. Action potential voltage threshold is negatively correlated with the maximal rate of depolarization during the action potential.
A, Three different action potentials during the rising phase. Vertical arrows depict the position of the threshold (left) and maximal slope (right). Inset, derivative of the action potential at the point indicated by the arrow. Note different time scale for the inset. B, Plot of the action potential maximal rising slope versus voltage threshold for all recorded action potentials (n = 633 spikes). The line is the best-fit line by the equation y(dV/dt) = −105.72 mV/ms – 7.38 ms−1*x(V), R = −0.725, p<0.0001, two-tailed t test. C, bottom, sequence of action potentials discharged by the cell shown in A. Top, derivative (dV/dt) of the membrane potential (intra-TRN) for the trace at the bottom. Note variation in peak amplitude in the derivative. D, Plot of the action potential maximal rising slope versus the inter-spike interval for all recorded action potentials (n = 633 spikes). The line is the best-fit line by the exponential function y(dV/dt) = 327.43 mV/ms+68.5 mV/ms*exp (x(V)/164.66 ms), p<0.05, Kolmogorov-Smirnov test. Scale bars: A, spike, vertical 20 mV, horizontal 0.1 ms; derivative, vertical 50 mV/ms, horizontal 0.1 ms; C, dV/dt, vertical 200 mV/ms, horizontal 20 ms; intra-TRN, vertical 50 mV, horizontal 20 ms. Some portions of raw data (intracellular voltage recordings) from the cell in this figure have been used in previous publications (see Methods).

