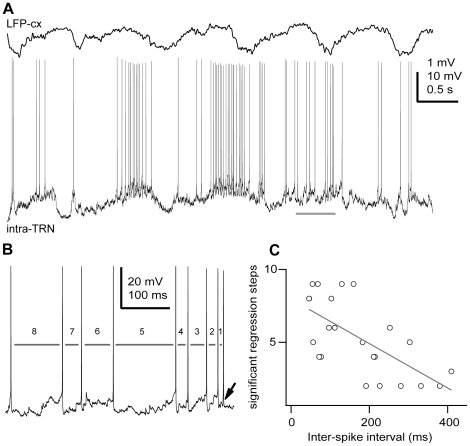
Figure 6. The action potential threshold depends on the occurrence of multiple previous action potentials.
A, In vivo intracellular recording of a TRN neuron during slow oscillations in the cortex (ketamine-xylazine anaesthesia) shows the large range of inter-spike intervals. B, A segment from A (horizontal bar) is expanded for clarity. For this cell, it was found that the threshold of any particular action potential (arrow) is influenced by eight previous ISIs (grey bars). C, Summary results for all TRN neurons recorded for this study. Plot of the number of significant partial regression steps (p<0.05) versus the mean ISI for each neuron. Line is the best-fit line by the equation y = −7.96–0.02*x(t), r = −0.8481, n = 23 cells, p<0.0001, two-tailed t test. Scale bars: A, LFP-cx 1 mV, intra-TRN 10 mV, 0.5 s; B, vertical 20 mV, horizontal 100 ms.

