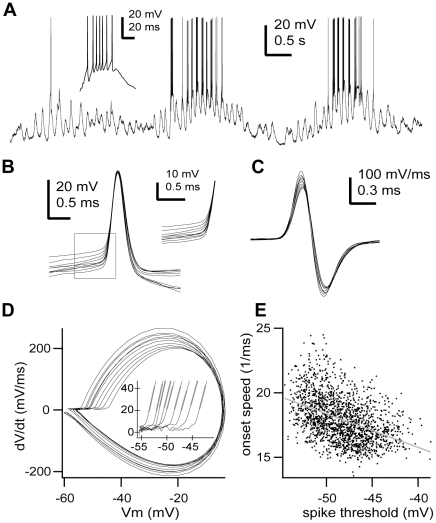
Figure 7. The onset speed of action potentials is voltage-dependent.
A, In vivo intracellular recording of a TRN neuron during spindle oscillations (pentobarbital anaesthesia). Inset, typical high-frequency burst discharge. B, Sample of consecutive action potentials (n = 10) from the cell shown in A. Inset, higher magnification of the action potential onset shows the absence of kink C, Derivative of the action potentials shown in B. Note different time scale than B. D, Phase plane representation of the action potentials shown in B. Note monophasic rate of rise. Inset, higher magnification of the action potentials onset shows the rapid onset. Grey lines show the linear fits used to calculate the onset speed of the action potentials. E, Plot of the action potential onset speed (slope of the initial rate of rise after the threshold (20 mV/ms) in the phase plane) versus voltage threshold. Line is the best-fit line by the equation y(onset speed) = 5.34 mV−1ms−1 – 0.26*x(Vm), n = 1722 spikes, r = −0.438, p<0.0001. Scale bars: A, vertical 20 mV, horizontal 0.5 s; inset, vertical 20 mV, horizontal 20 ms; B, vertical 20 mV, horizontal 0.5 ms; inset, vertical 10 mV, horizontal 0.5 ms; C, vertical 100 mV/ms, horizontal 0.3 ms. Some portions of raw data (intracellular voltage recordings) from the cell in this figure have been used in previous publications (see Methods).

