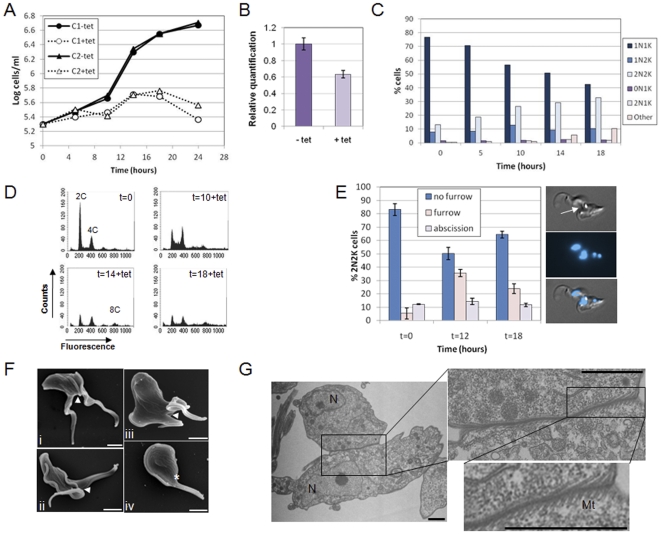
Figure 1. KAT80 is essential for cytokinesis in bloodstream stage T. brucei.
A. Cumulative growth curves of two independent bloodstream KAT80 RNAi clones (C1: clone 1; C2: clone 2) cultured in the presence or absence of tetracycline (tet). B–G show data for clone 1; data for clone 2 is comparable (not shown). B. Real time PCR analysis showing downregulation of KAT80 transcript 14 hours post-induction with tetracycline (tet). Error bars represent standard deviations. C. DAPI staining. The nucleus (N) and kinetoplast (K) configurations of >200 cells per time point following RNAi induction are shown. ‘Other’ comprises mainly multinucleate and/or multi-kinetoplast cells. D. DNA content analysis. The fluorescence of 10,000 propidium iodide-stained cells was analysed by flow cytometry at the time points (in hours) indicated. The ploidies of peaks are given. E. Cytokinesis stage analysis. 2N2K cells (n>100 cells per time point) were analysed for their cytokinesis stage. Error bars represent standard deviations of 3 biological replicates. Example image of 2N2K furrowing cell shown on right. Top panel: DIC image; middle panel: DAPI image; bottom panel: merge. Arrow indicates the furrow. F. SEM analysis of induced KAT80 RNAi cells (t = 12.5 hours). i-ii: furrowing cells; iii: furrowing cell with rounded posterior end; iv: cell with posterior end folded back towards the anterior. Arrowheads point to furrows while the asterisk indicates the posterior end in (iv). Scale bars: 2 µm. G. TEM analysis of a furrowing cell following induction (t = 12.5 hours) of KAT80 RNAi, enlarged as indicated to visualise subpellicular microtubules (Mt). N: nucleus. Scale bars: 1 µm.

