
Figure 5.
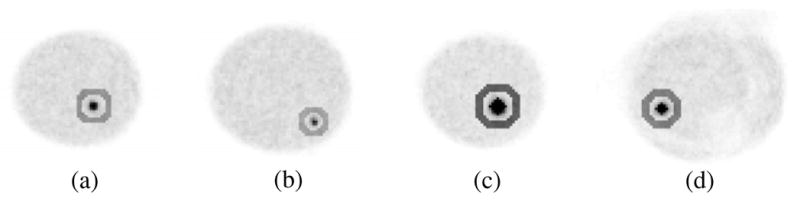
Example ROIs for (a)–(b) breast-only and (c)–(d) breast+filled torso reconstructed data. (a) 9-pixel square ROI is drawn inside and 264-pixel annular ROI drawn about the centrally-located 0.43 ml lesion; (b) 4-pixel square ROI is drawn inside and 216-pixel annular ROI drawn about the 0.26 ml lesion; (c) 25-pixel diamond ROI is drawn inside and 420-pixel annular ROI drawn about the centrally-located 2.3 ml lesion; (d) 13-pixel diamond ROI is drawn inside and 348-pixel annular ROI drawn about the 1.1 ml lesion.