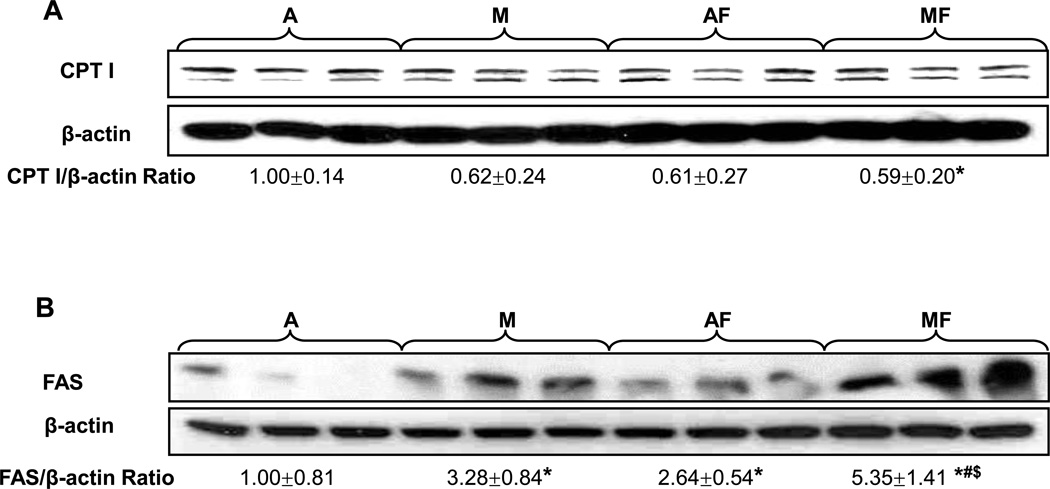
Fig. 5. Effect of marginal copper deficiency and fructose feeding on the expression of hepatic lipid metabolic enzymes.
(A) Hepatic CPT I and (B) FAS expression was determined by Western Blots. There are two bands in CPT I, with the top one being the liver isoform. Optical density of band was quantified by ImageJ software. The ratio to β-actin was calculated by assigning the value from adequate copper diet controls as one. Data represent means ± SD (n=3). *p<0.05 versus A; #p<0.05 versus M; $p<0.05 versus AF. A, adequate copper diet; M, marginal copper deficient diet; AF, adequate copper diet+30% fructose drinking; MF, marginal copper deficient diet+30% fructose drinking.

