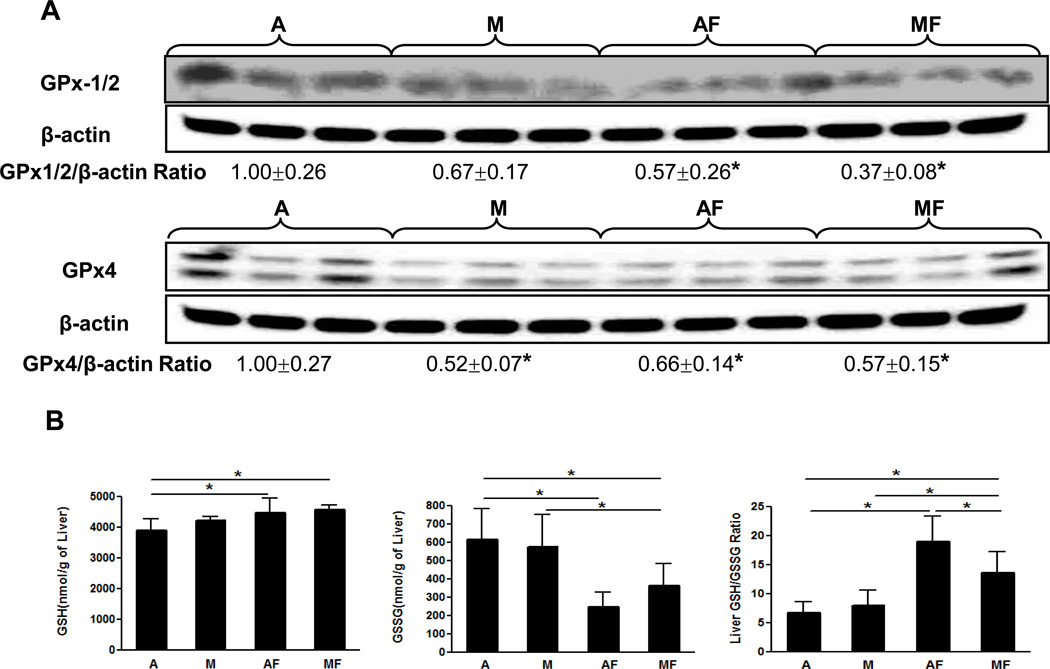
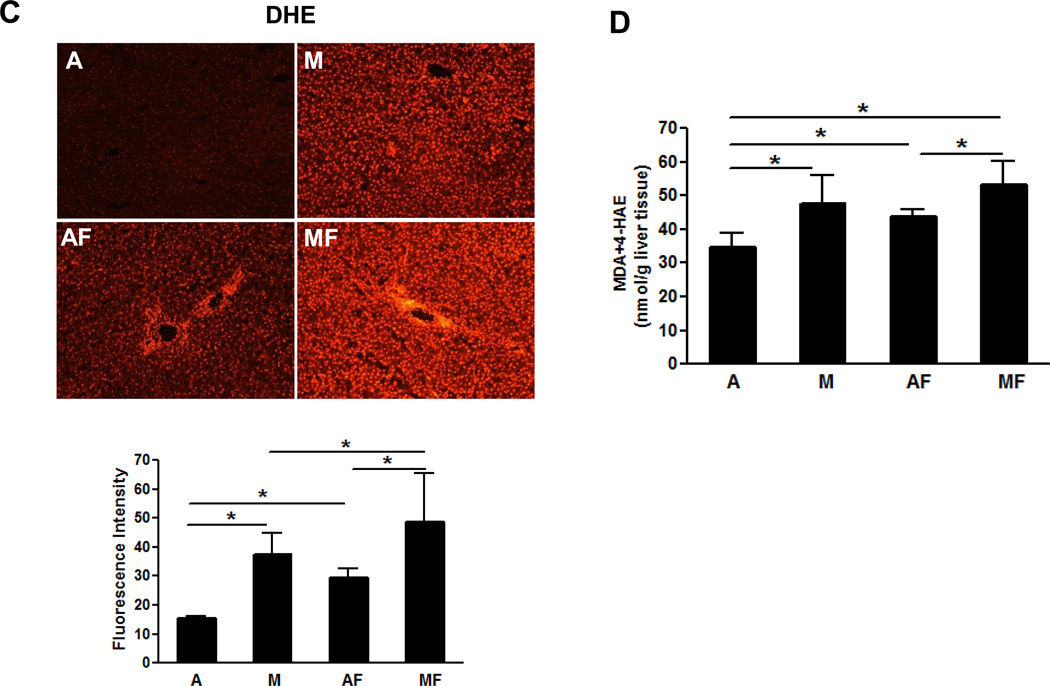
Fig. 6. Effect of marginal copper deficiency and fructose feeding on hepatic antioxidant defense system.
(A) Hepatic GPx1/2 and GPx4 expression were determined by Western Blots. Optical density of band was quantified by ImageJ software. The ratio to β-actin was calculated by assigning the value from adequate copper diet controls as one. Data represent means ± SD (n=3). *p<0.05 versus A. (B) Hepatic GSH, GSSG and GSH/GSSG ratio measured by HPLC. (C) Representative photomicrographs of the dihydroethidium staining of liver section (100×) and quantification (bottom). Dihydroethidium is oxidized by superoxide to yield red fluorescence that binds to the nucleic acids, staining the nucleus a bright fluorescent red. The bottom figure showed the mean of red fluorescence density quantified by Image J. Data represent means ± SD (n=4–9). *p<0.05. (D) Lipid peroxidation was assessed by MDA+4-HAE in liver homogenate. Data represent means ± SD (n=5–9). *p<0.05. A, adequate copper diet; M, marginal copper deficient diet; AF, adequate copper diet+30% fructose drinking; MF, marginal copper deficient diet+30% fructose drinking.


