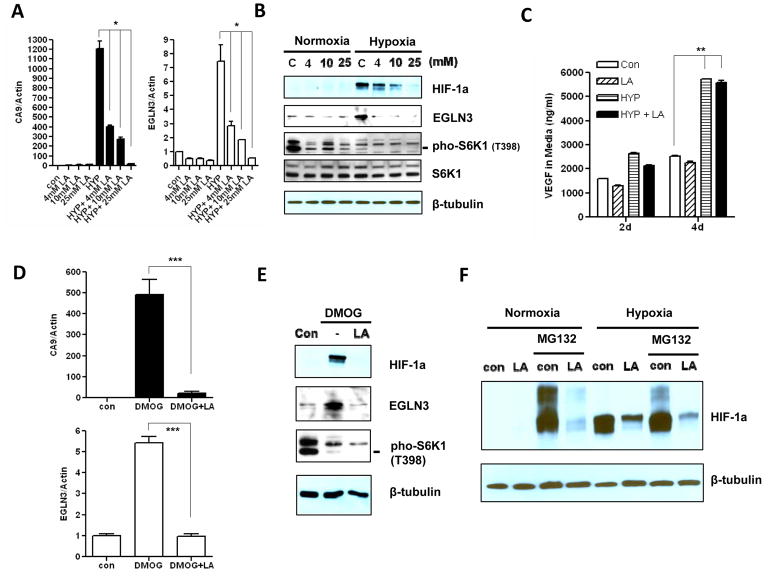
Figure 2. The repression of hypoxia response by lactic acidosis is mediated by inhibition of HIF-1α protein synthesis.
(A) The mRNA levels of CA9 and EGLN3 in MCF7 cells measured by RT-qPCR treated with indicated lactic acid concentration (pH 6.7) either in normoxia or in hypoxia condition for 24 hrs (n=3). (B) Immunoblot detection of HIF-1α and EGLN3 protein expressions, and S6K phosphorylation at Thr-398 in MCF7 cells treated as (A). (C) The concentration of VEGFA in media was detected by ELISA assay at indicated days and treatments (10 mM Lactic acid pH 6.7. n=3). (D) The mRNA levels of CA9 and EGLN3 in MCF7 treated with control, DMOG or DMOG plus lactic acidosis (10 mM Lactic acid pH 6.7) in normoxia condition (n=3). (E) Immunoblot detection of HIF-1α and EGLN3 protein expressions, and S6K phosphorylation at Thr-398 in MCF7 cells treated as (C). (F) The HIF-1α protein expression level was determined in MCF7 cells treated with lactic acidosis (10 mM Lactic acid, pH 6.7) in either normoxia or hypoxia condition for 18 hrs, then further treated with the protease inhibitor MG132 (10 μM) for additional 4 hrs. Error bars are mean ± SD, significant p-values are indicated as (* p<0.001; ** p<0.0001; *** p<0.001).

