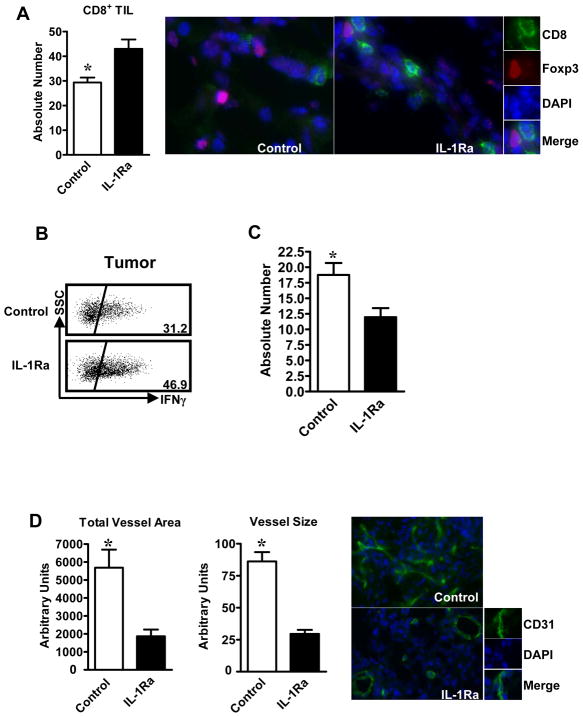
Figure 5. IL-1 blockade altered immune phenotype and tumor vascularization in IL-10−/− mice.
(A). Increased tumor-infiltrating CD8+ T cells in Anakinra-treated IL-10−/− mice. Immunofluorescent staining was performed on tumor tissue sections. The absolute numbers of CD8+ T cells were counted. Results are expressed as the mean values +/− SEM per 15 high-powered fields (HPF). N = 5 mice per group. *P < 0.05, Anakinra versus control. (B). Increased tumor-infiltrating IFNγ+CD8+ T cells in Anakinra-treated IL-10−/− mice. Single-cell suspensions were made from tumor tissues. The cells were stained for CD8 and intracellular IFNγ. Results are expressed as the mean percent of IFNγ+CD8+ T cells in CD8+ cells +/− SEM. N = 4–5 mice per group. *, P < 0.05, Anakinra versus control. (C). Reduced tumor-infiltrating Treg cells in Anakinra-treated IL-10−/− mice. Immunofluorescent staining was performed on tumor tissue sections. The absolute numbers of Foxp3+ T cells were counted. Results are expressed as the mean values +/− SEM per 15 high-powered fields (HPF). N = 5 mice per group. *, P < 0.05, Anakinra versus control. (D). Reduced tumor vascularization in Anakinra-treated IL-10−/− mice. Immunofluorescent staining was performed to analyze the expression of CD31 in tumor tissue sections. The areas of CD31+ vessels and the size of CD31+ vessels were analyzed as detailed in Materials and Methods. Results are expressed as the mean area or size of vessels +/− SEM in 10 HPF. N = 4–5 mice per group. *, P < 0.05, Anakinra versus control.

