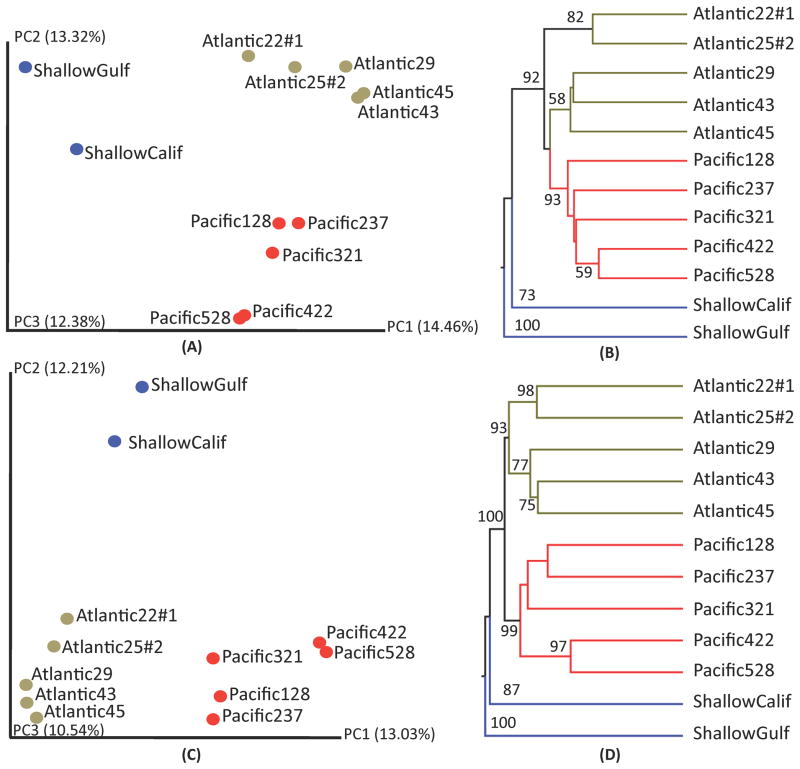
Figure 3. Results of phylogenetic community analyses using the Fast Unifrac toolkit (Hamady et al. 2010).
Data represents forward sequencing reads from Region 1 of the 18S gene. Principle Coordinate analysis of OCTUs clustered using a 95% (A) and 99% (C) pairwise identity cutoff in the OCTUPUS pipeline. Jackknifed Cluster Analysis of OCTUs clustered at 95% (B) and 99% (D); colors represent geographic origin, and support values >50% are reported.

