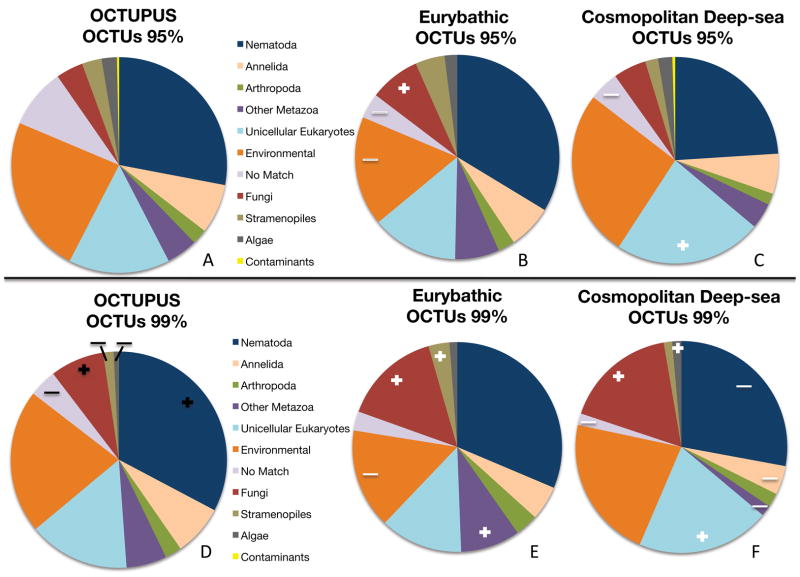
Figure 4. Proportions of eukaryotic taxa recovered under relaxed (95%) and stringent (99%) clustering in the OCTUPUS pipeline.
Proportions calculated from non-chimeric OCTUs representing forward sequencing reads from both 18S gene regions. Only significant proportional increases (+) and decreases (−) are outlined across datasets; Black symbols represent changes observed between differential clustering of non-chimeric sequence reads at 95% (A) versus 99% (D) cutoffs. White symbols represent proportional changes between all non-chimeric OCTUs and subsets of OCTUs with observed eurybathic (B, E) and cosmopolitan (C, F) distributions.

