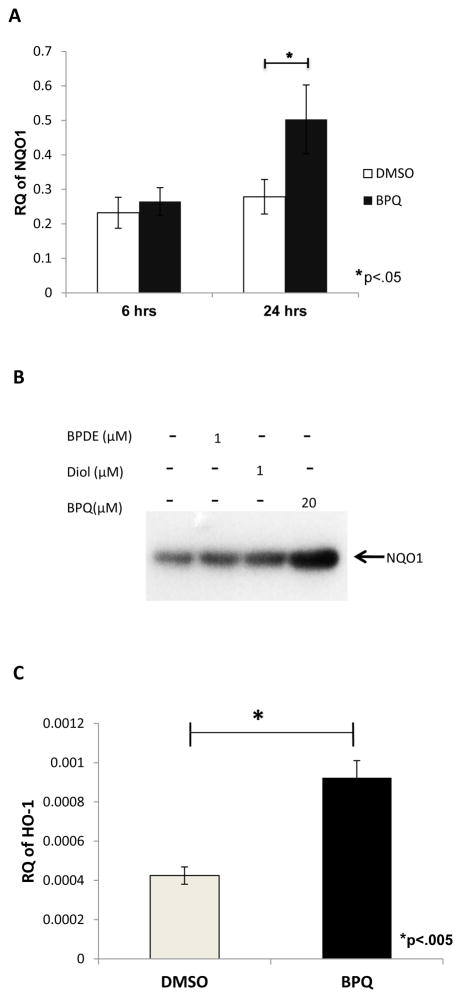
Figure 4.
Increase of NQO1 and HO-1 mRNA levels in A549 cells treated with BPQ. A) Realtime PCR showing expression levels of NQO1 mRNA in A549 cells treated with BPQ for 6 hrs and 24hrs. C) Western blot analysis for NQO1 in A549 cells treated with PAH metabolites. D) Realtime PCR showing increase in HO-1 mRNA levels isolated from A549 cells treated with B[a]P-7,8-dione for 24 hrs. All realtime PCR experiments were performed with 3 biological replicates in triplicates for each sample and standardized to GAPDH expression levels.

