Figure 3.

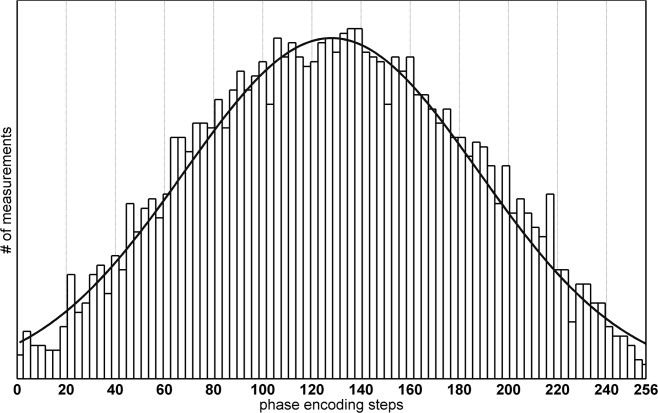
Histogram of all phase-encoding steps over the full cycle of all acquired N timeframes per slice. Each individual sampling scheme represents a random choice of phase encodings steps weighted according to a Gaussian distribution.

Histogram of all phase-encoding steps over the full cycle of all acquired N timeframes per slice. Each individual sampling scheme represents a random choice of phase encodings steps weighted according to a Gaussian distribution.