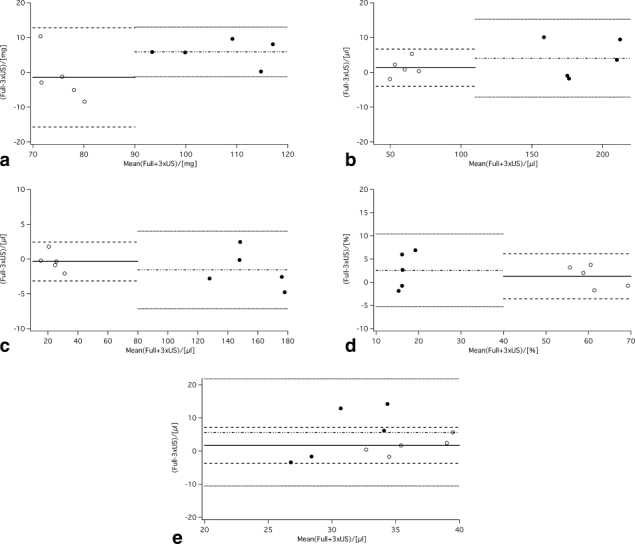
Figure 5.

Bland–Altman plots comparing 3-fold undersampled CS data (sham, open symbols; MI, closed symbols) versus standard (ie, fully sampled) acquisition for (a) LV mass, (b) EDV, (c) ESV, (d) EF, and (e) SV (n = 5 each). The solid line indicates the bias for the sham hearts (dashed lines ± 2 SD), and the dashed-dotted line depicts the bias for the MI hearts (dotted lines ± 2SD), respectively.
